This article explains the architecture of Node debugging tool Node Inspector. It requires basic prior knowledge of node, debugging tool node inspector and client server technology. In case you missed please Google for basic knowledge of Node.js, Node Inspector and Client/Server technologies before move further. I hope in the end, you have enough understanding how you can write your own debugger for node like eclipse, sublime text, Bracket etc.
As a developer, there always comes what you’re doing becomes so complex it makes your head spin. That time you need a real debugger to help what is going on inside your code. I used multiple debuggers without knowing internal but this time I tried to understand node inspector internal. I started searched documentation on web for Architecture/Design of any node debugger tool but unfortunately it was not there.
As developer there is no way except dive into code and see what is going on. It took me few days to understand whole architecture of this tool but it was more than simple messaging between client/server under one protocol like http. Just trying to capture my finding in my own way with visual presentation.
I am assuming that you know the steps to debug a node “hello World” programe using Node Inspector. Now we will see all steps two start the debugging using node-inspector
Step 1 Start inbuilt node debugger using command node —debug-brk helloworld.js
 it’s means node inbuild debugger server is running on port 5858.
Step 2 Start node Inspector using command node-inspector
 It’s means node-inspector start a http server on port 8080 and passing port number 5858 on which node inspector connect to node debugger server.
Step 3 open the tab in browser with URL http://127.0.0.1:8080/debug?port=5858
 you can see breakpoint on first line inside webkit webinspector (Debugger for Webkit browser) as you ask in step1.
So far it seems that there is message exchange happening between client (Web inspector) and Server (Node inbuilt debugger)
Obviously few questions arise in mind
- Is there any protocol betwenn client and server for message exchanging like http,FTP?
- Is Client/Server have same type of connect like TCP, HTTP, WebSocket?
- How message back-forth happening between client->Server and Server->Client?
- What is the role of node inspector module for passing these message?
Definately, there are protocols under which communication is happening but Our client and Server both know different protocol. Our client Web-Inspector use WebKit remote debugging protocol and Server use V8 remote debugging protocol. That means there is no common protocol between Client/Server then How they can talk to each other? it cleary visible in diagram1

Another point is Our Client is WebSocket but server is TCP. how we can pass message from websocket client to TCP server. Hmm Preety Interesting so far.
It pretty understable that we need a proxy who will do following things for us
- Run WebSocket Server
- Run TCP Client
- Have mappeing between both protocol to convert message from one protocol to another protocol.
Who is doing above task? is it Node Inspector? Yes, You are right. Node Inspector module is play a role of proxy and doing these. see diagram 2
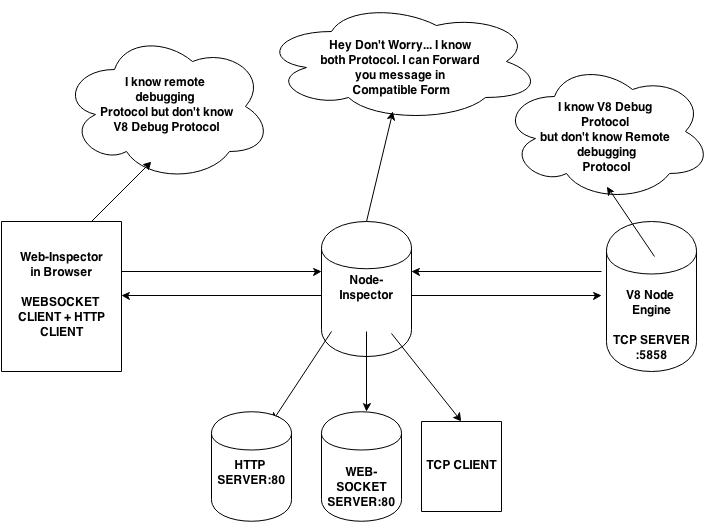
Node inspector getting message from client using web socket server and sending these message to node debugger server using tcp client after converting from one protocol to another protocol.I took one snap of this converstion on my terminal when you click on step over button in web inspector.See the diagram4

Now it’s pretty clear all components of Node Inspector. let’s try to see at granular level what happen when you click on step over in browser :
Step1. Web inspector send the message {“method”:“Debugger.stepOver”,“id”:29} to websocket server which is part of node inspector using webkit remote debugging protocol.
Step2. Node inspector use protocol converter for convert this message to remote V8 debugging protocol like below
    {"seq":14,"type":"request","command":"continue","arguments":{"stepaction":"next","maxStringLength":10000}}
    {"seq":15,"type":"request","command":"backtrace","arguments":{"inlineRefs":true,"fromFrame":0,"toFrame":50,"maxStringLength":10000}}
Step3: Send step2 message to TCP server using TCP client which is part of node inspector module.
Step3. node debugger take the action according to the message.
it’s time to compile all the components together inside nice diagram.

I explained role of each component in node debugging flow except HTTP Client/Server. Browser is http client inside the flow to fetch web inspector application from http server which is part of node inspector to start debugging.
 In above diagram there are three context 1. Global Scope chain 2. Outer Scope chain 3. Inner Scope chain. Javascript try to find out the variable from inner scope chain to Global scope chain always. Let’s go step by step to analysis output of the program